
A Guide on How to Make an Effective Potty Training Chart
This post contains affiliate links. As an Amazon Associate, we learn from qualifying purchases
A real potty training chart is a two-week diagnostic tool, not a sticker reward board. You track wet and dry periods hourly, note patterns linked to meals and drinks, and use that data to build a schedule that matches your child’s body, not a generic advice book.**
The difference changes everything. A sticker chart guesses when to go. A data-driven chart tells you. It turns the frustrating guesswork into a predictable routine, especially for kids who show few classic readiness signs or have developmental differences.
What follows: the exact tracking method from an NHS health board, a breakdown of what data actually matters, a free template you can use today, and how to pivot from tracking to training without losing momentum.
Key Takeaways
- Track for a full two-week baseline. Shorter periods miss patterns that emerge over days.
- Check the diaper every hour and mark “W” for wet or “S” for soiled. Folding a piece of kitchen roll inside the diaper makes wetness easier to detect and builds sensory awareness.
- The goal is to find your child’s natural elimination windows, not to get them to use the potty during tracking. Schedule sits 5-15 minutes before those predicted times.
- A chart must track three things: time, wet/dry status, and context (like “after breakfast” or “drank 4oz milk”). For children with disabilities or autism, structured charts and visual supports are often essential for building a predictable routine.
What a Real Potty Training Chart Actually Does
Forget the stars and smiley faces for a moment. The primary function of an effective potty training chart is data collection, not motivation. Its job is to answer one question: when does my child’s body naturally need to go?
The Cardiff and Vale University Health Board (CAVUHB) advises using their chart over a two-week period to identify patterns. You’re not training yet. You’re observing. This baseline period reveals the hidden rhythm, maybe they’re always wet 45 minutes after their morning milk, or consistently dry through a two-hour nap.
Common mistake: Using a chart only as a reward system. If you jump straight to stickers for successful potties without the baseline data, you’re rewarding luck, not reinforcing a predictable biological schedule. The child hasn’t learned their body’s signals, and accidents will stay frequent.
This data is your leverage. It replaces the exhausting cycle of asking “Do you need to go?” every 30 minutes with strategic, timed sits that align with their physiology. It’s the difference between shooting in the dark and having a map.
The Two-Week Baseline: How Long to Track
How many days of data do you need? The consensus from primary sources is clear: more than a weekend.
| Source | Recommended Tracking Duration | Primary Purpose |
|---|---|---|
| Cardiff and Vale UHB | Two-week period | Establish patterns of wet/dry times and link them to food/drink intake. |
| UNL ASD Network | Up to 2 weeks for baseline data | Determine the most consistent schedule for urination and bowel movements. |
| Ocali.io | At least 3 days to up to two weeks | Understand the child’s routines to create a supportive schedule. |
| Autism Speaks | 3 “typical” days | Document routine and time between drinking and wetting. |
The two-week standard exists because patterns can be daily, every-other-day, or tied to specific weekly activities. A three-day snapshot might catch a pattern, but a two-week view confirms it. Think of it as a scientific sample size. The larger the sample, the more reliable your schedule will be.
Where this goes sideways: Stopping after three days because you see a pattern. If that pattern shifts on day four, which it often does with diet or activity changes, your entire training schedule is built on incomplete data. The extra days are insurance against false positives.
What to Track (And What to Skip)
A cluttered chart is a useless chart. You need just enough information to see cause and effect, not a novel of every moment. Focus on these three columns.
1. Time & Wet/Dry Status
This is the core. Use the CAVUHB method: check the nappy every hour. Mark “W” for wet, “S” for soiled, and leave it blank if dry. The “kitchen roll trick” is genius here. Fold a piece of kitchen roll and place it inside the diaper. It makes wetness instantly obvious to the touch and helps your child feel the damp sensation against their skin, building that critical sensory connection between the act and the feeling.
2. Context Clues
In a notes column, jot down what happened before the check. This turns data into insight. – “Drank 5oz water” – “Just woke from nap” – “30 minutes after lunch” – “Playing hard outside”
3. Flexible Timing Cues
As the Vale of York CCG notes, not every slot needs a clock time. For the “scheduled sit” times you’ll derive, use cues like “on waking” or “after breakfast.” This makes the routine resilient to daily schedule shifts.
What not to track: mood, every single snack, or the exact number of minutes spent on the potty during this phase. That comes later. Right now, you are a neutral observer of outputs.
How to Make Your Chart: A Step-by-Step Guide
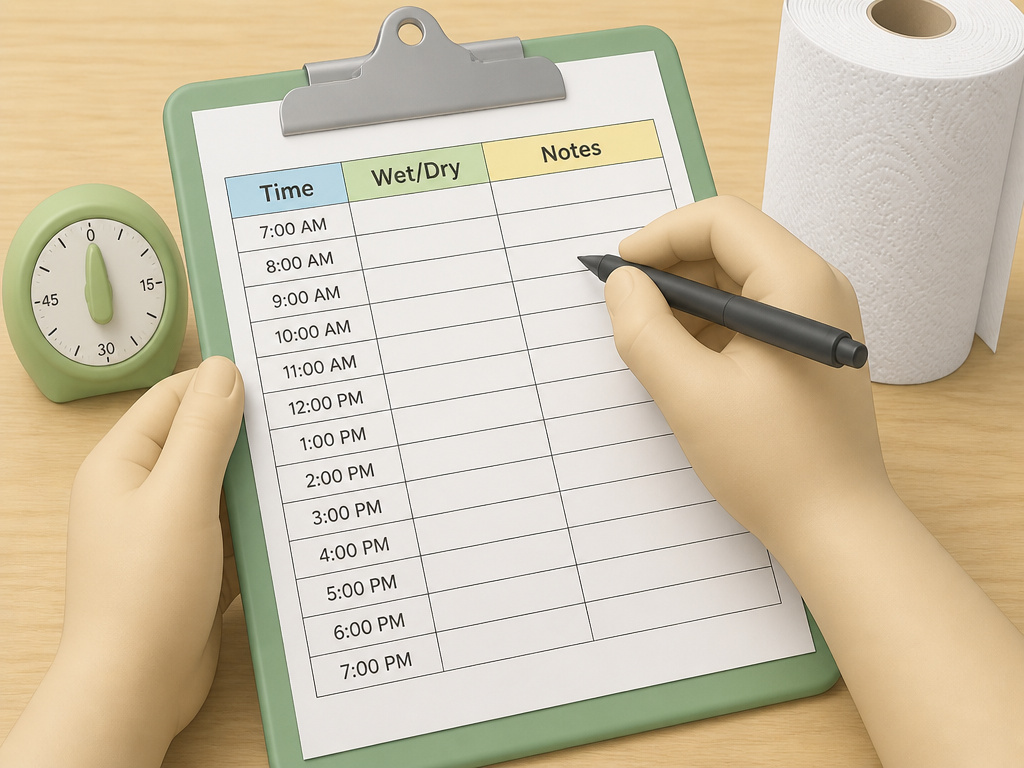 You need a simple grid. You can draw it on paper, use a spreadsheet, or download our free printable template. Here’s how to build it.
- Set Up Your Grid. Label rows with times, typically from when your child wakes until they go to bed, in one-hour increments (e.g., 7:00 AM, 8:00 AM, 9:00 AM). Label columns: “Time,” “Wet/Dry,” “Notes,” and “Scheduled Sit.”
- Gather Your Tools. You’ll need the chart, a pen, and a timer set to remind you every hour. Have the kitchen roll ready for diaper checks.
- Observe and Record. Every hour, check and mark. Be consistent, even if you’re sure they’re dry, check. The point is to confirm the dry periods.
- Note the Context. In the “Notes” column, add the relevant pre-event (drank, ate, slept).
- Analyze After 3 Days and 14 Days. After 72 hours, look for early patterns. After two weeks, circle the most predictable wet times. These become your target zones.
The part nobody mentions: The act of hourly checking itself becomes a ritual. It shifts your focus from outcome to observation, which reduces everyone’s anxiety. You’re not failing if they’re wet; you’re successfully collecting data.
From Tracking to Training: Building the Schedule
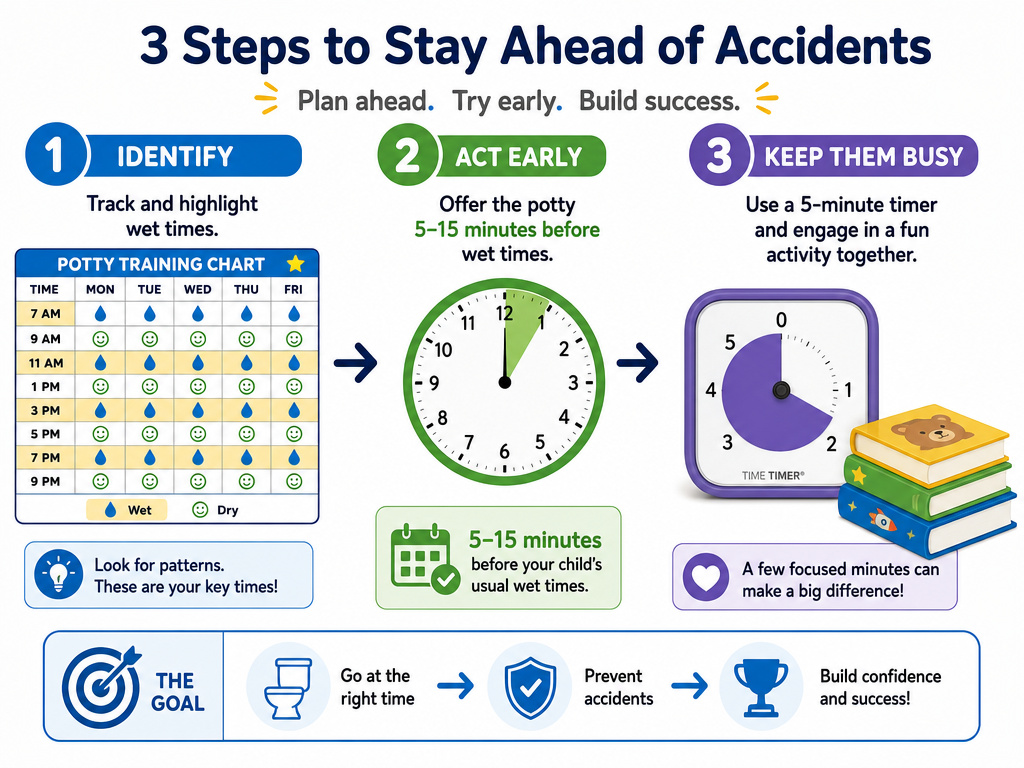 After two weeks, your chart is no longer a record. It’s a planning document. Here’s how to convert data into action.
First, identify the 2-3 most consistent times your child was wet. These are your bullseye. According to the UNL ASD Network, you should then take your child to the bathroom 5-15 minutes before each of those predicted times. You’re proactively getting them to the toilet just before their body is ready to go.
Second, decide on sitting duration. This isn’t a punishment. – Start with 3-5 minutes, as the UNL resource suggests. – Use a visual timer they can see. – Make it pleasant: read a book, sing a song. – If nothing happens after the time, say “All done for now!” and move on without disappointment. The goal is establishing the routine, not immediate success.
This is where you integrate reward systems. Reward the sit itself initially, then shift to rewarding successful eliminations. This phased approach is a core effective reward system for potty training.
Adaptations for Children with Disabilities or Autism
For neurodiverse children or those with physical disabilities, the chart isn’t an option; it’s a foundational support. The principles are the same, but the tools are sharper.
Structured Visual Schedules
A chart is a visual support. For children who thrive on predictability, a visual schedule showing the steps (walk to bathroom, pull down pants, sit, etc.) reduces anxiety about the unknown. The Ocali.io resource emphasizes this heavily.
Extended Sitting Schedules
Some intensive methods, like those outlined in the ACT Community data sheet, begin with scheduled sits as long as 30 minutes to maximize the chance of success and quickly build the habit. This is a specific technique often used under guidance, not a general starting point.
The Critical Role of Data
When progress is slow or non-verbal cues are hard to read, the data is your only objective guide. It helps you distinguish between a behavioral refusal and a mis-timed schedule. If you’re navigating potty training a resistant toddler, this data is what tells you if you’re dealing with timing or temperament.
Leveraging authoritative guides is crucial. For example, the Autism Speaks toilet training guide provides tailored strategies that align with this data-driven approach, and the UNL ASD Network toileting webinar handout offers evidence-based techniques from special education professionals.
Pitfalls and How to Avoid Them
A chart is a tool. Like any tool, it can be used poorly. Here are the broken patterns.
Pitfall 1: The Inconsistent Check
You track diligently for two days, then get busy and guess. The data set is now corrupted. Inconsistent tracking gives you a false pattern. Set phone alarms. Make the chart central in your kitchen.
Pitfall 2: Misreading the Data
You see wetness at 10 AM for three days and schedule a potty sit at 9:45 AM. But your notes show they drank a huge cup of water at 9:30 AM each time. The real pattern is “wet 30 minutes after large drink,” not “wet at 10 AM.” The context column is what separates correlation from causation.
Pitfall 3: Forgetting the “Why”
The chart is a means to an end: a calm, predictable routine. If filling it out causes stress, you’ve lost the plot. It should reduce uncertainty, not create a new chore. If it’s not working, the problem might be common challenges unrelated to timing, like fear of the flush or physical discomfort.
Free Printable Template and Next Steps
To start immediately, you can create your own grid or use a simplified version of the CAVUHB chart. The core layout is simple.
| Time | Wet (W) / Dry ( ) | Notes (Meal, Drink, Activity) |
|---|---|---|
| 7:00 AM | Woke up, drank milk | |
| 8:00 AM | After breakfast | |
| 9:00 AM | W | Played in living room |
| 10:00 AM |
Print several copies for the two-week stretch. Keep them on a clipboard with a pen attached.
Your next step after tracking is to formalize the schedule. Use your data to pick 4-5 daily sit times. Introduce a fun activities basket for the bathroom to make sits enjoyable. Remember, the chart got you here, but now you transition to active training, using methods like the three-day method if a quick start fits your child’s temperament.
If you’re just starting potty training, this chart is your first and most important move. For gender-specific considerations, see our guides on potty training boys and potty training girls. And always confirm the right age and readiness before beginning.
Frequently Asked Questions
How often should I check the diaper when tracking?
Check every hour during waking hours. This is the standard from the Cardiff and Vale UHB chart. For a more intensive look, especially when tracking the time between drinking and wetting, Autism Speaks suggests checking as often as every 15 minutes.
My child hates sitting on the potty. How long should I make them sit?
Start with the absolute minimum they will tolerate, even 5 seconds. The UNL ASD Network recommends 3-5 minutes for training sits. The key is to gradually increase from their baseline tolerance with a timer, never forcing. Making the sits positive with a special book or song is more important than the duration.
Can I use a sticker chart alongside this tracking chart?
Yes, but keep them separate. Use the data-tracking chart for your eyes only to find patterns. Use a simple, visual sticker chart with your child to reward cooperation with sitting or successful potty use. This prevents the child from feeling judged for “W” marks on the tracking sheet.
What if I see no pattern after two weeks?
This is valuable data. It likely means your child’s elimination is not yet regular enough for schedule-based training. It may indicate a need to focus more on building readiness skills, like tolerating the bathroom, pulling pants down, or understanding wet/dry, before trying again. It can also signal constipation, which should be discussed with a pediatrician.
Is this method suitable for nighttime training?
No. This baseline tracking method is for daytime training. The CAVUHB guide explicitly states that staying dry at night is a skill that develops later, often after daytime control is mastered. Nighttime training involves different physiological factors.
The Bottom Line
A potty training chart is a diagnostic map. The two-week investment in hourly tracking pays off in clarity, turning a vague process into a series of predictable, scheduled events.Use the kitchen roll trick. Write down the context. Let the data, not your frustration, dictate the next move.
This method works because it respects the child’s unique biology. It’s the reason health boards and autism specialists publish these specific charts. Skip the guesswork. Download the template, grab a pen, and start observing. The path to the potty is in the data you haven’t looked at yet.
